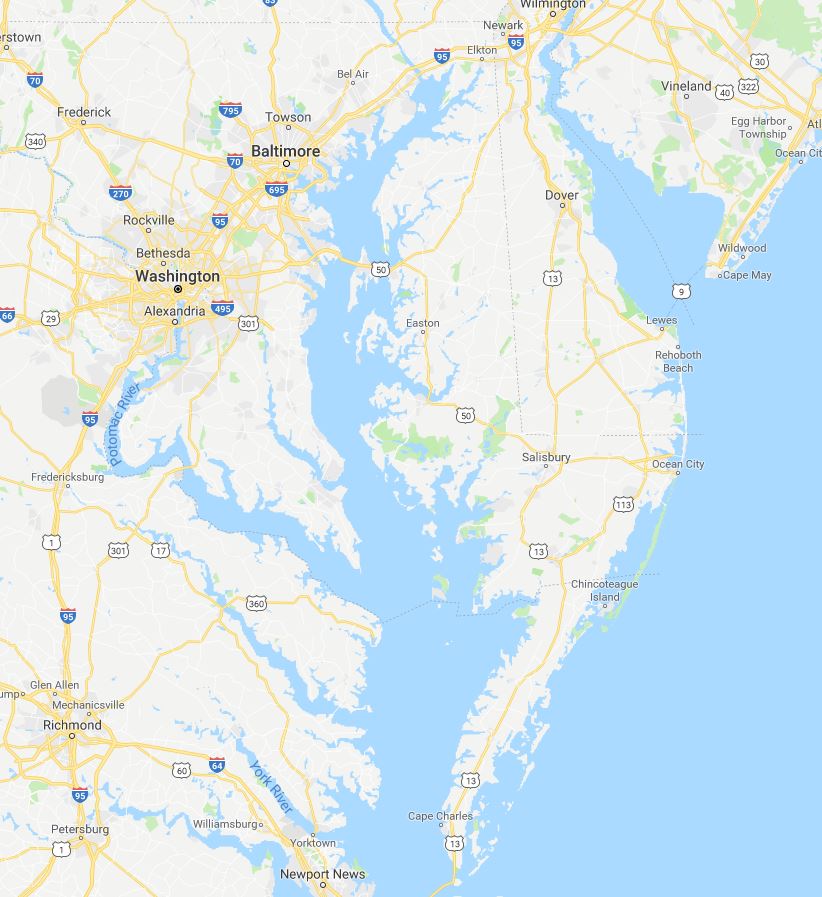
To view both nuisance flooding and strom inundation maps, choose the Two Dimensional Maps figure above. Here you can view the projections from 2003, 2050, and 2100. The maps can be zoomed in to a specific area at a street level zoom to determine if ypour desired area is flooded. The maps are created using openstreet with an overlay with the flood data for the desired scenario of your choosing. There are Min, Mean, and Max scenarios for both RCP 4.5 and RCP 8.5.
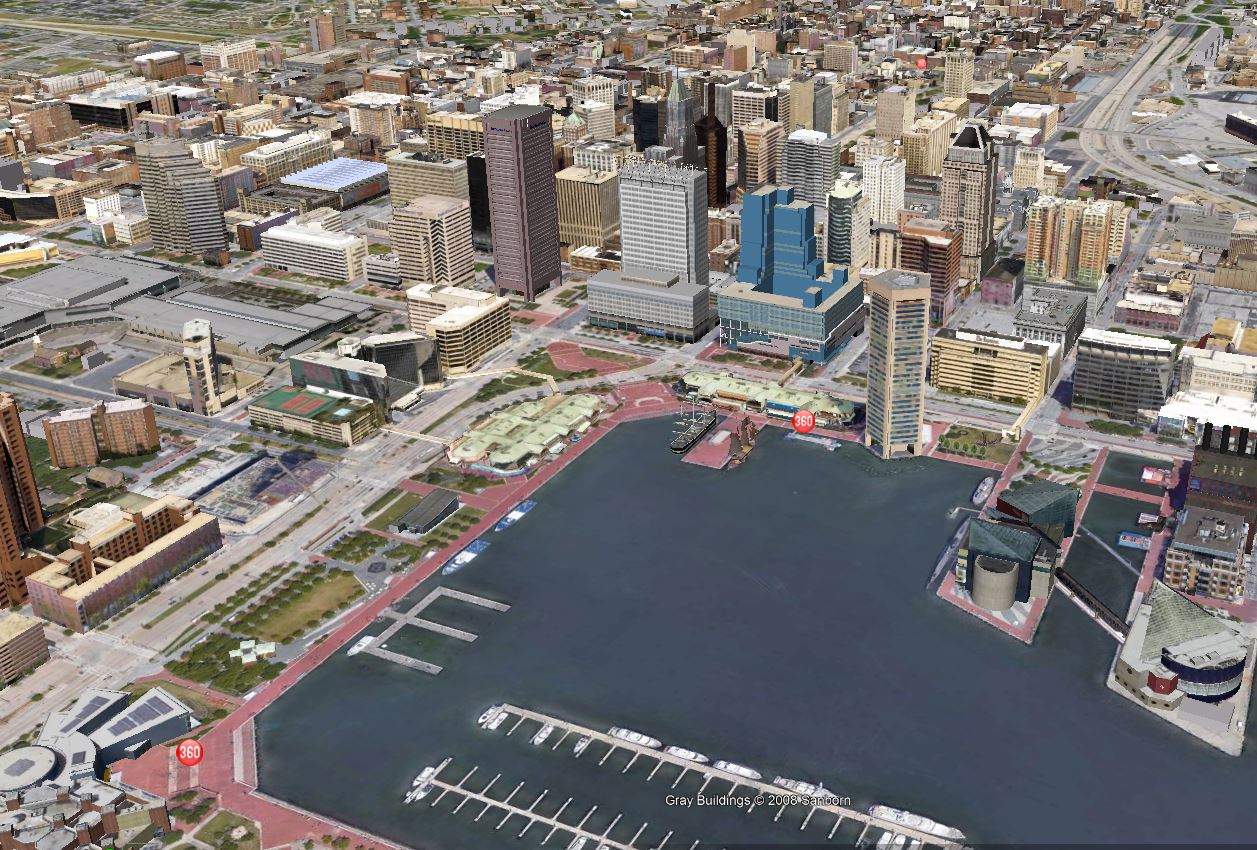
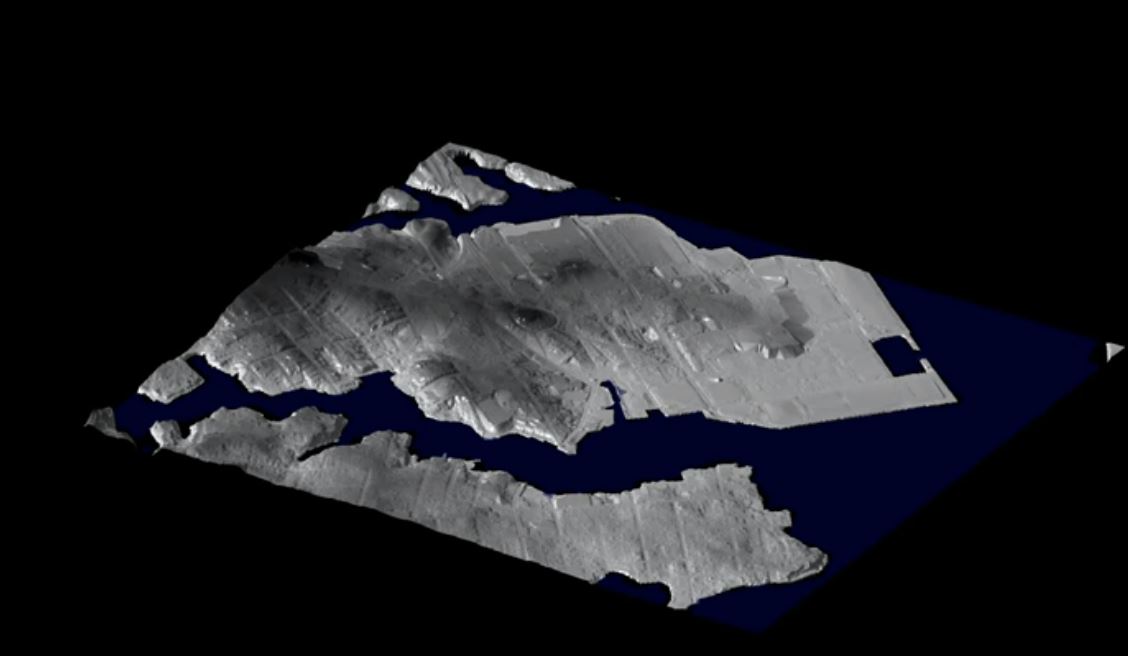
To get a closer look at the flooding in Baltimore City, choose the figure above and you can choose a spoecific area in the city to view a three dimensional flood map of the city. Here you can choose the same conditions as the two dimensional maps. The maps are rendered using Google Earth which means that Google Earth must be installed on the device you are using to view the maps. If you do not have Google Earth, you can click
HERE to download the software needed to view the maps.
To view a timeline of the storm inundation floodings, click on the figure above. This will open up a page with videos showing the timeline of flooding for 2003 Hurricane Isabel and the predicted flooding from a similar storm in 2100 under RCP 8.5 Mean. The three areas of focus for these timelines are Baltimore City, Annapolis, and Dorchester County. The videos are uploaded to the site via youtube so they are compatible for all devices. You can either click the expand button in the corner of each video to view full screen or keep it the same size and click through the different videos.
Representative Concentration Pathways, or (RCP's) are the different scenarios describing the alternative trajectories of carbon dioxide. RCP trajectories are generally used to describe scenarios between 2000 and 2100. Researchers will agree on a set of guidelines used to make these assumptions on future use and trajectories of carbon dioxide to prepare their data. The different levels of RCP used to create these trajectories are RCP2.6, RCP4.5, RCP6, and RCP8.5. The two RCP's used in this study are RCP4.5 and RCP8.5.